
Data Preparation for Prediction Model
Where do bikeshare trips start?
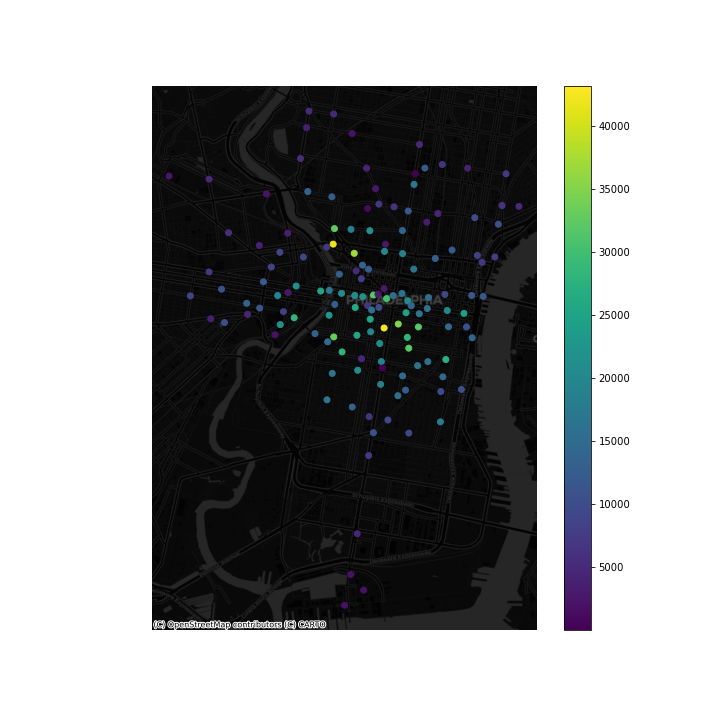
To study trip generation, the following analysis will focus on the trio-starting stations. The map below shows that most trips start within Center City, and based on the previous analyses, they also “stay within” Center City. The most popular starting-stations are close to city center or Schuylkill River trail.
Variable Selection
To run a trip prediction model, different types of variables and chosen, and they can be divided into the following categories:
1. Bikeshare Internal Factors
- Total number of docks at a given station (“totalDocks”)
- Distance to nearest Indego station (“logNearStationDists”)
- Demand (total starting trips) of the nearest 5 stations (“laggedTrips”)
2. Facilities/Attractions nearby
- Distance to restaurants, pubs, and bars (“logDistRests”)
- Distance to cafe (“logDistCaf”)
- Distance to parks (“logDistPk”)
- Distance to tourist attractions (“logDistTour”)
- Distance to supermarket (“logDistSupermkt”)
- (Binary) Located in Center City Business District or not (“within_centerCity”)
3. Transportation Factors
- Distance to subway stations (“logDistSubw”)
- Distance to bus stations (“logDistBus”)
- Distance to nearest intersection (“logIntersectionDists”)
4. Population Statistics (of the census block group where the station locates)
- Median Household Income (“medhhincome”)
- Percentage of Household Car Ownership (“percent_car”)
Preliminary Correlation Test
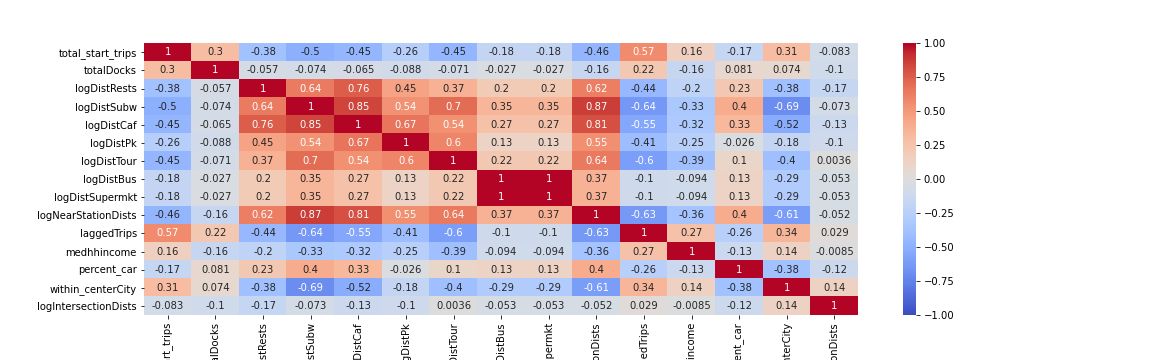
A correlation test is conducted before running the machine learning model. According to the test, the variables that contribute the most to trip generation are:
- Effects of nearby Indego stations
- Lagged trips
- Distance to nearest Indego station
- Distance to subway
- Distance to cafe
- Distance to tourist attraction
Other factors, especially the demographic statistics, are not performing quite well in the test. It might be that Indego stations are clustered in Center City, and therefore the stations clusters will be assigned the same census data, so the model is unable to tell the nuanced difference between different stations.
Noticeably, the factors that indicate distance to nearby facilities are highly correlated to one another, potentially due to trip chaining. Distance to bus stop and distance to supermarket is perfectly colinear. It might be that supermarket are easily accessible through bus network.
Updated Correlation Test
After taking off some variables that perform poorly in the correlation test, the updated list of variables include:
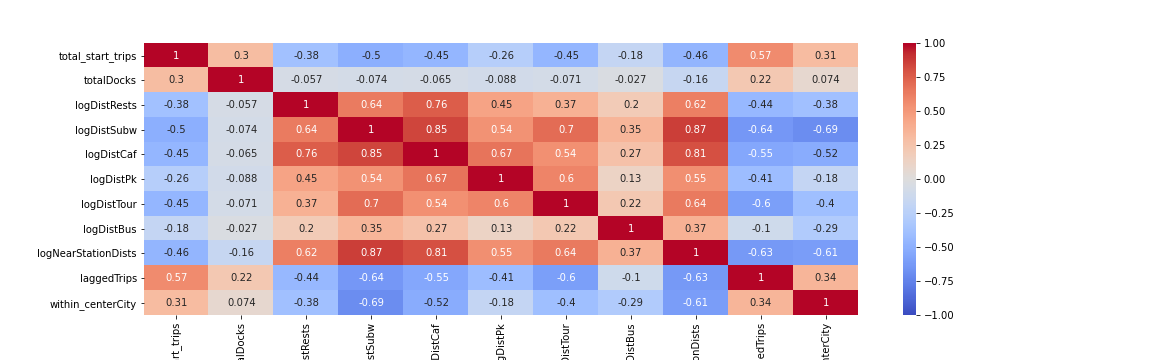
1. Bikeshare Internal Factors
- Total number of docks at a given station (“totalDocks”)
- Distance to nearest Indego station (“logNearStationDists”)
- Demand (total starting trips) of the nearest 5 stations (“laggedTrips”)
2. Facilities/Attractions nearby
- Distance to restaurants, pubs, and bars (“logDistRests”)
- Distance to cafe (“logDistCaf”)
- Distance to parks (“logDistPk”)
- Distance to tourist attractions (“logDistTour”)
- (Binary) Located in Center City Business District or not (“within_centerCity”)
3. Transportation Factors
- Distance to subway stations (“logDistSubw”)
- Distance to bus stations (“logDistBus”)